Imagine this: you’re trying to make sense of a complex system. It’s like a tangled ball of string. But then, you see a diagram—clear, easy to understand, it makes everything click. That’s the power of visualizing information with diagrams and flowcharts.
You might have heard of tools like Microsoft Visio. It’s a playground for flowchart enthusiasts, letting you drag and drop shapes to build intricate diagrams. But did you know there’s another, surprisingly simple way to create these charts? All you need is text. It’s streamlined, plays nice with version control tools like Git, and fits right in your Markdown editor.
But hold on, there’s a snag. Text-based diagramming tools, such as Mermaid.js, have a learning curve. Sure, they’re handy for a variety of diagrams, from Gantt to Git graphs, User Journey Diagrams, and beyond. But they’re not exactly a walk in the park for beginners.
Don’t worry though, we’ve got your back. In this guide, we’re going to walk you through two easy methods to create diagrams. It’s for everyone, whether you’re enjoying ChatGPT for free or as a Plus user. Let’s untangle that ball of string, shall we?
The basic method of creating diagrams with ChatGPT is conversational. You describe the diagram you need, and ChatGPT generates the necessary text or code. Mermaid.js, a Javascript library that creates diagrams in a Markdown-like format, is a popular option. So you can write a prompt like this:
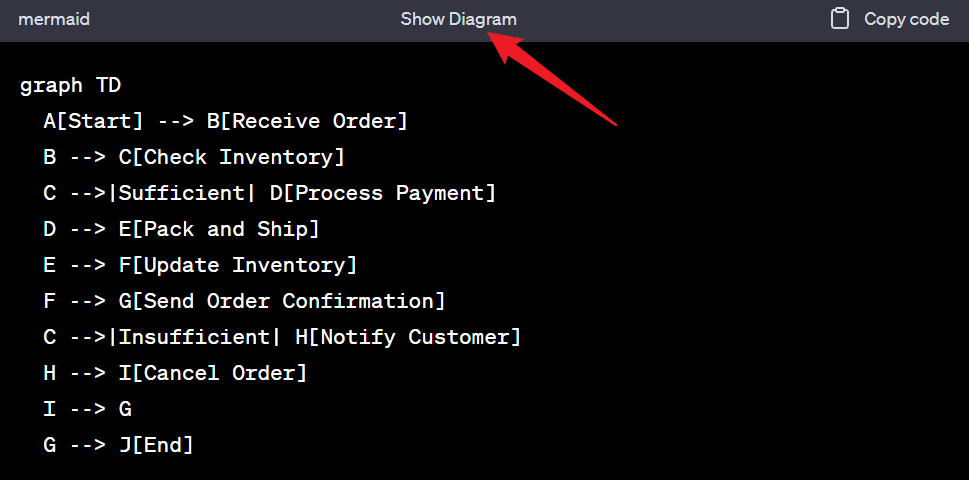
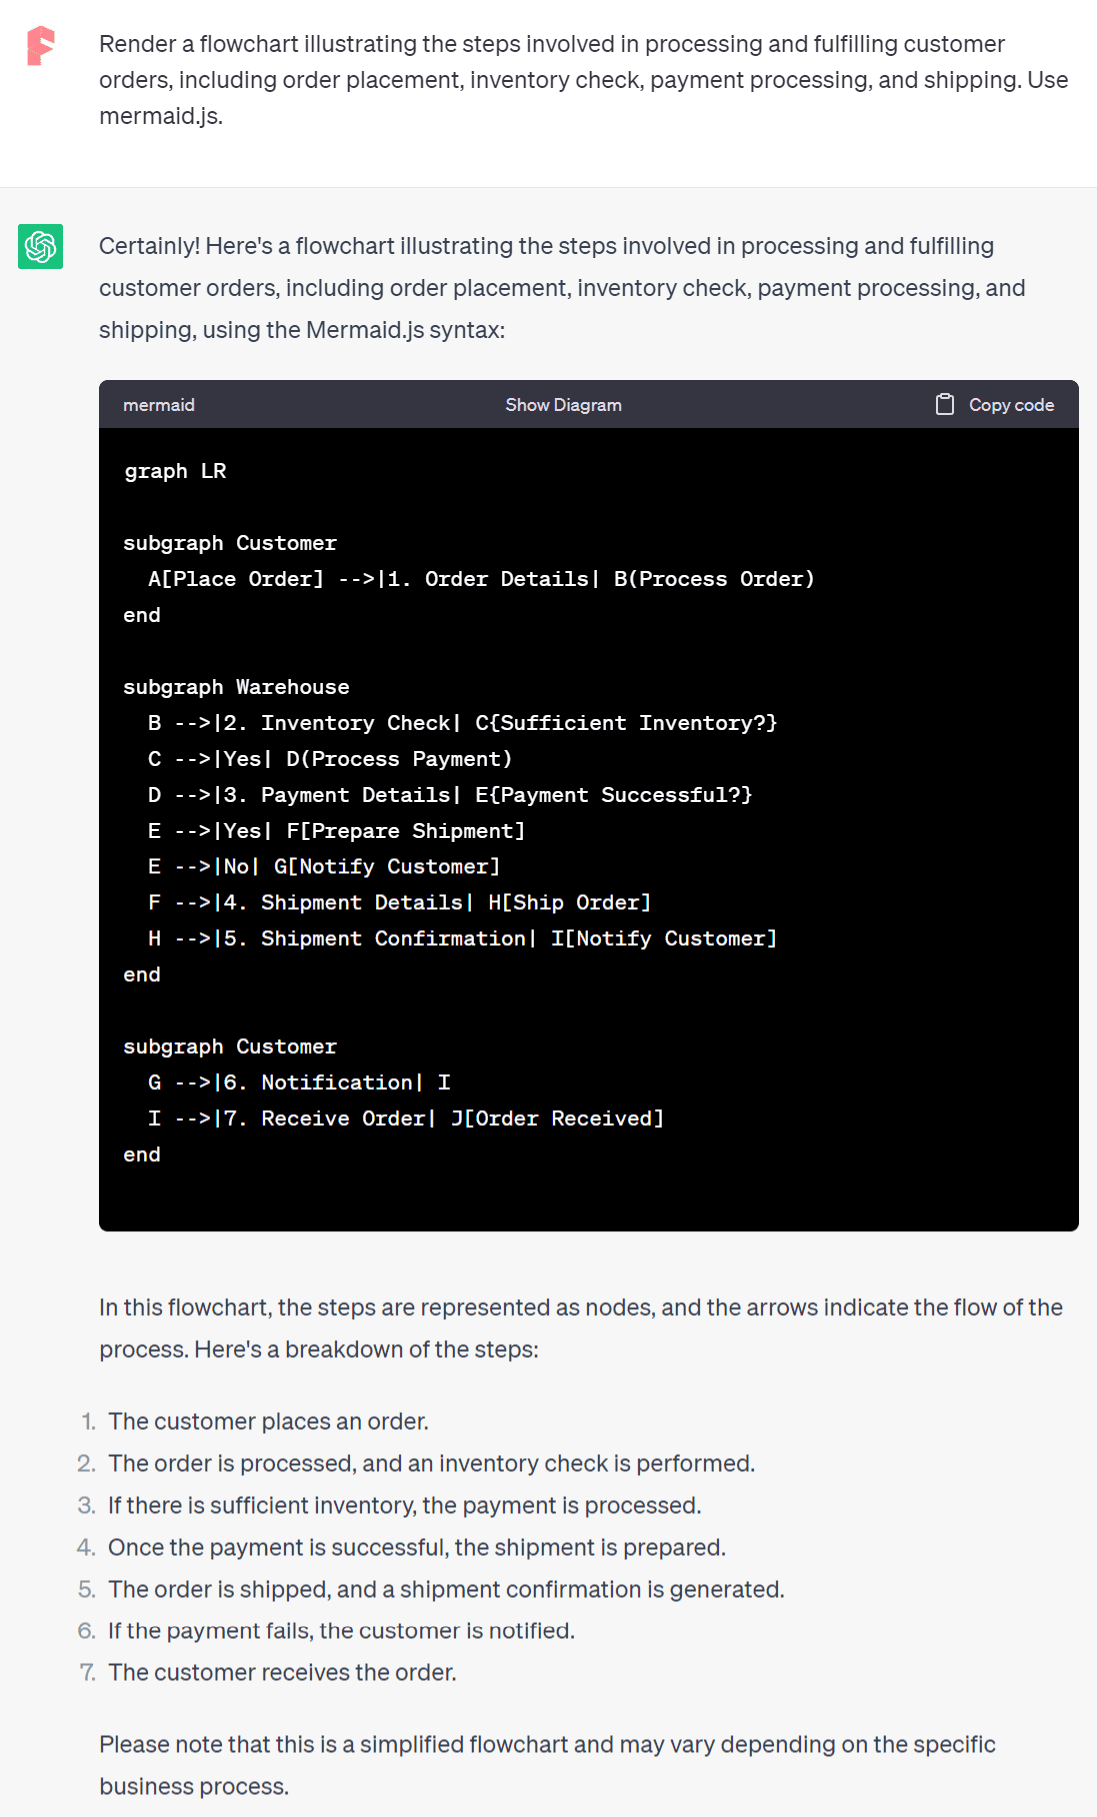
Render a flowchart illustrating the steps involved in processing and fulfilling customer orders, including order placement, inventory check, payment processing, and shipping. Use mermaid.js.
ChatGPT will then generate the code for the diagram you want. But it can’t directly turn it into a visual diagram. However, with the ChatGPT Diagrams Google Chrome extension, it can now render the diagram.
This extension would add a “Show Diagram” button above the generated code, and you can view the rendered diagram by clicking this button.
Here’s how to set it up.
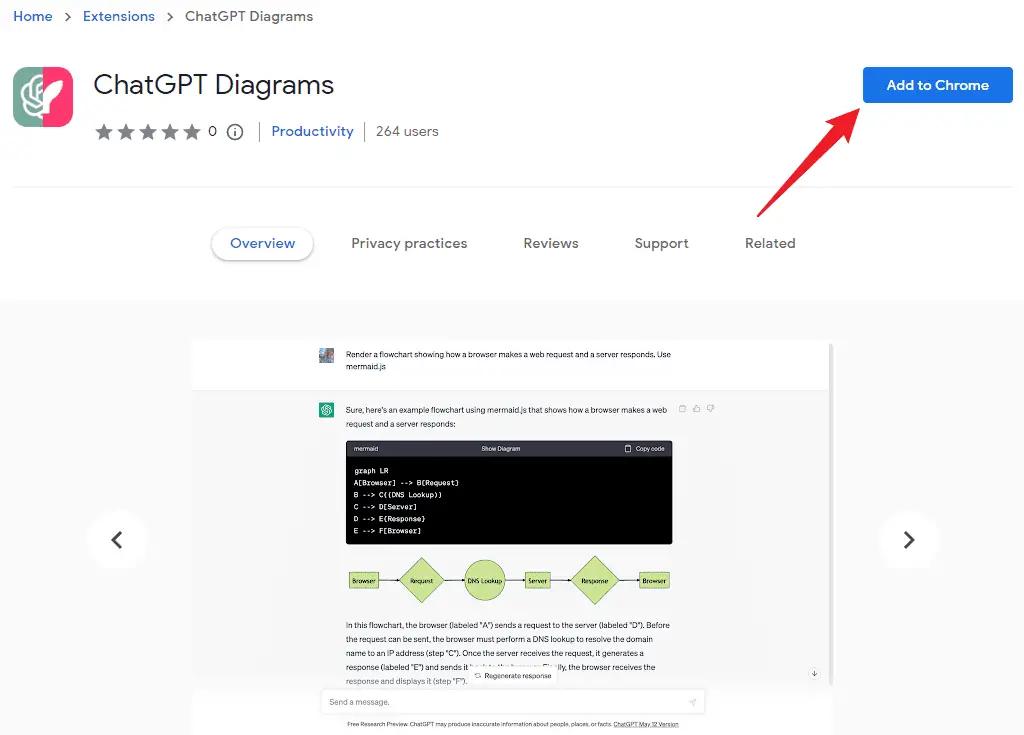
Visit the following URL to access the ChatGPT Diagrams extension installation page.
Click the puzzle-shaped button in the top right corner of Google Chrome to open your extensions list and confirm the extension is installed.
Then you can start having ChatGPT generate diagrams, for example by submitting the prompt we just wrote to ChatGPT:
Click “Show Diagram” above the code box to render the diagram.
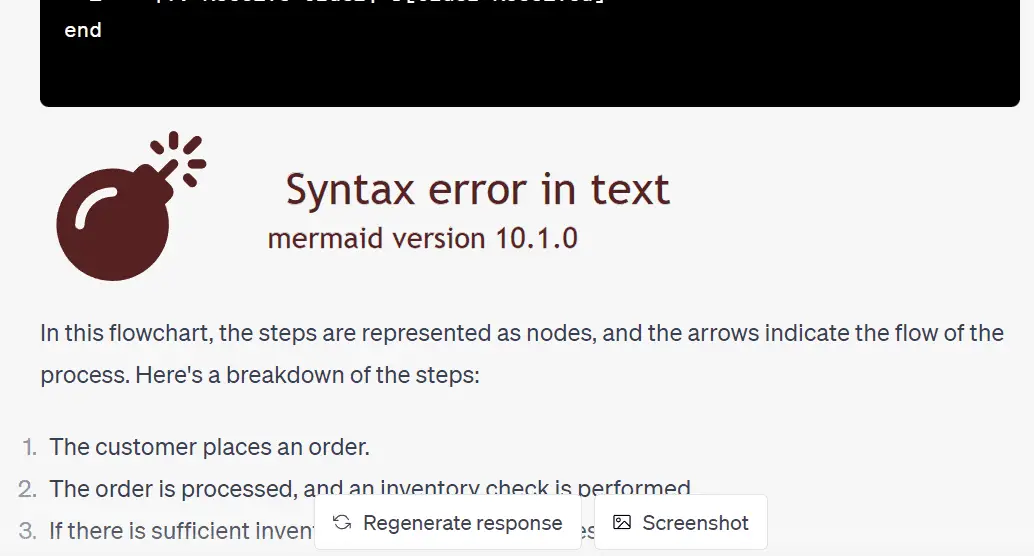
If you encounter an error, refresh the page and click on ChatGPT’s history conversation to go back to the previous screen. Click “Show Diagram” again, and your diagram should appear.
If the diagram doesn’t show, or if you wish to export it, copy the code from the box to this website.
There, you can create an account and export your diagram in PNG or SVG format.
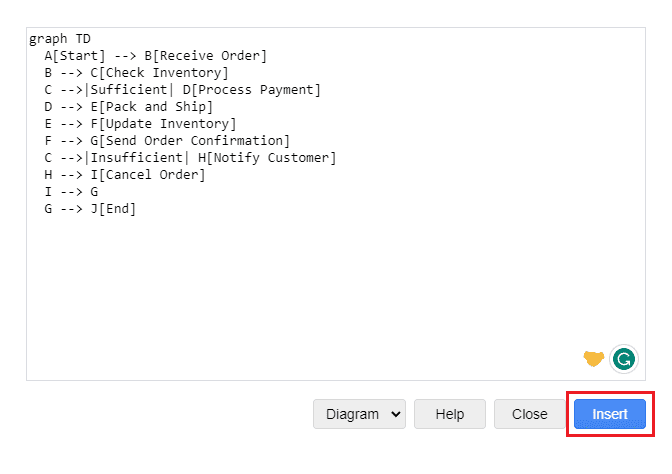
Another popular free option is draw.io. Open the website, then navigate to “Arrange” -> “Insert” -> “Advances” -> “Mermaid” in the menu bar.
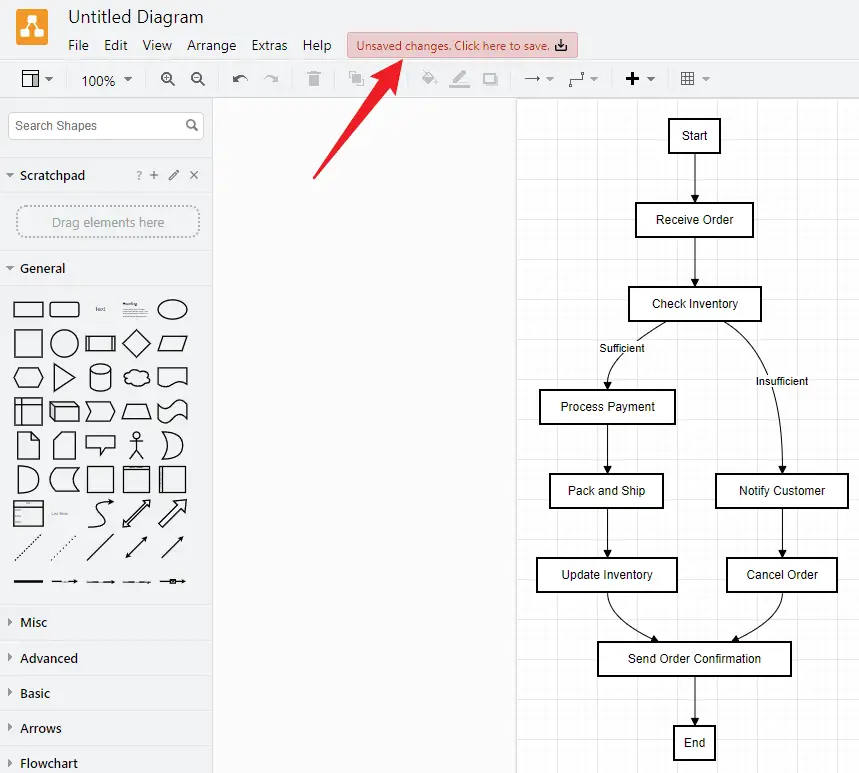
Paste the code into the pop-up box, click “Insert”, and then save.
For any modifications to the diagram, you can make them directly in the editor. Or, you can ask ChatGPT to generate the revised code for you.
ChatGPT Plugin Show Me Diagrams
For ChatGPT Plus users, the third-party plugin, Show Me Diagrams, allows you to generate diagrams easily. It can also help you create many graphic types, including bar, line, and scatter charts, streamgraphs, circular plots, box plots, maps, and more.
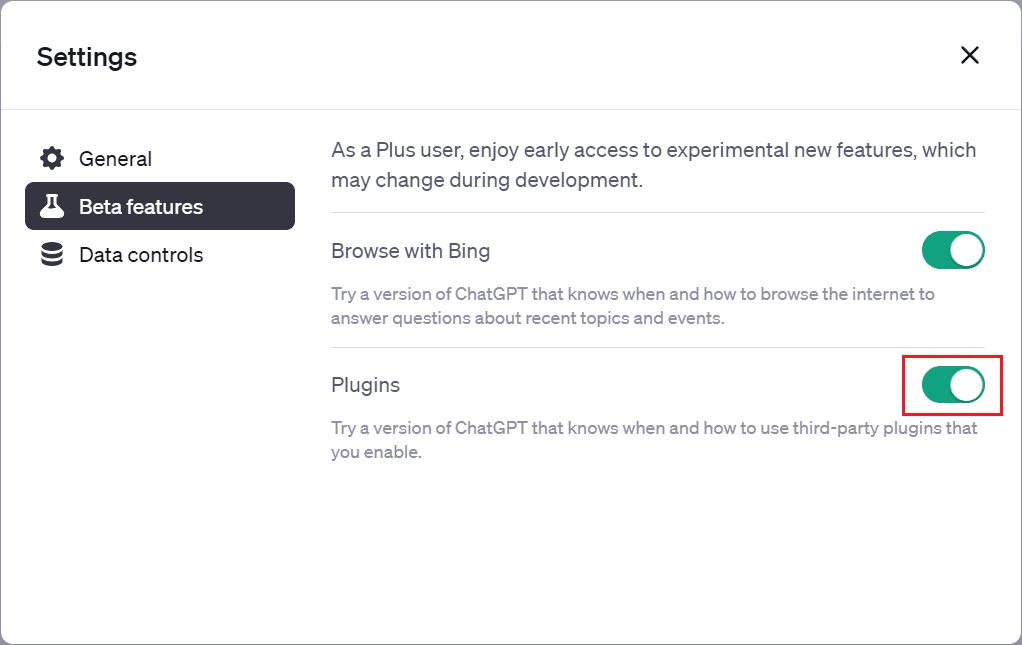
To utilize this plugin, first, ensure your ChatGPT plugin functionality is activated.
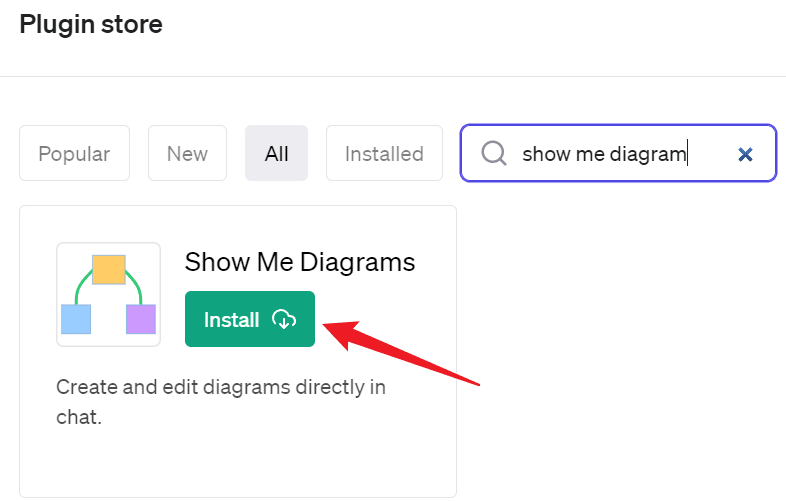
Navigate to the ChatGPT Plugin Store and search for “show me diagram”.
Click “Install” to add it to your toolkit.
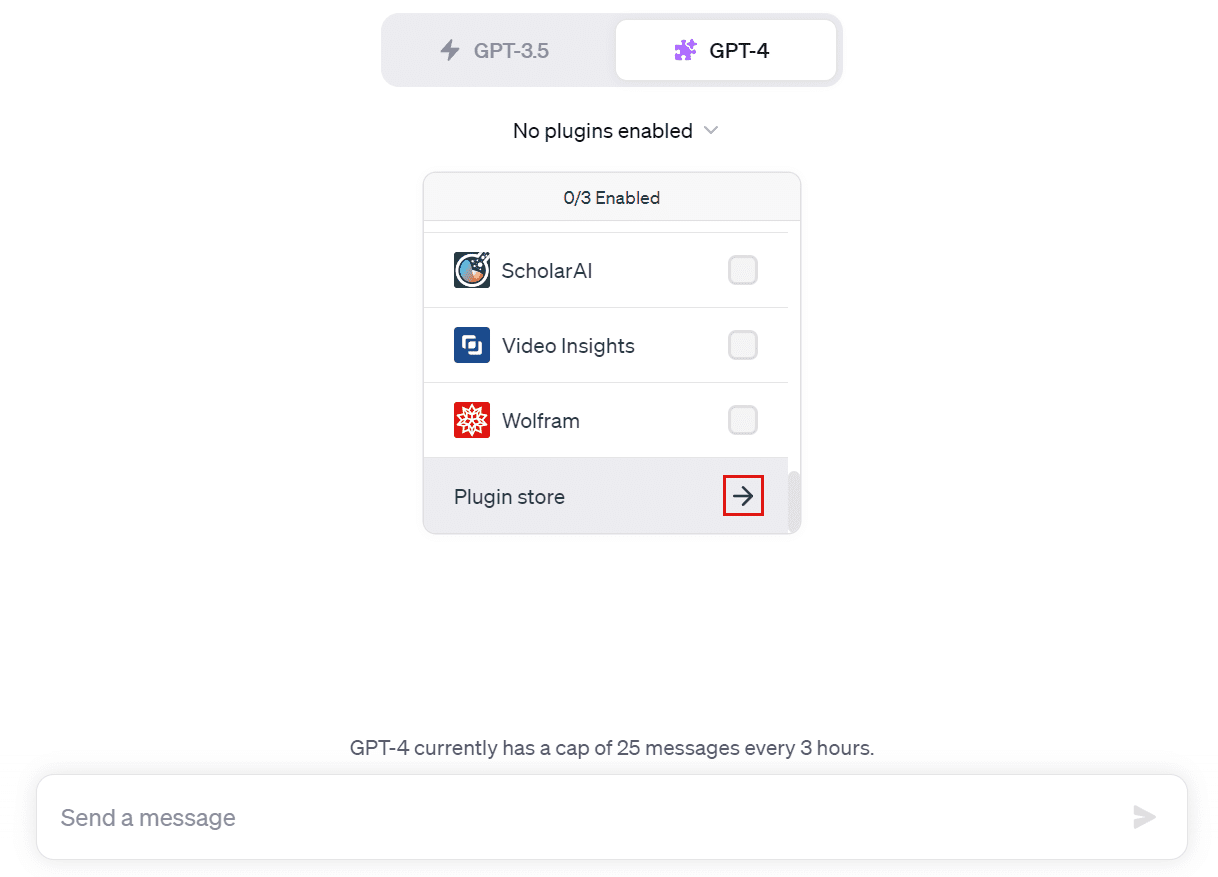
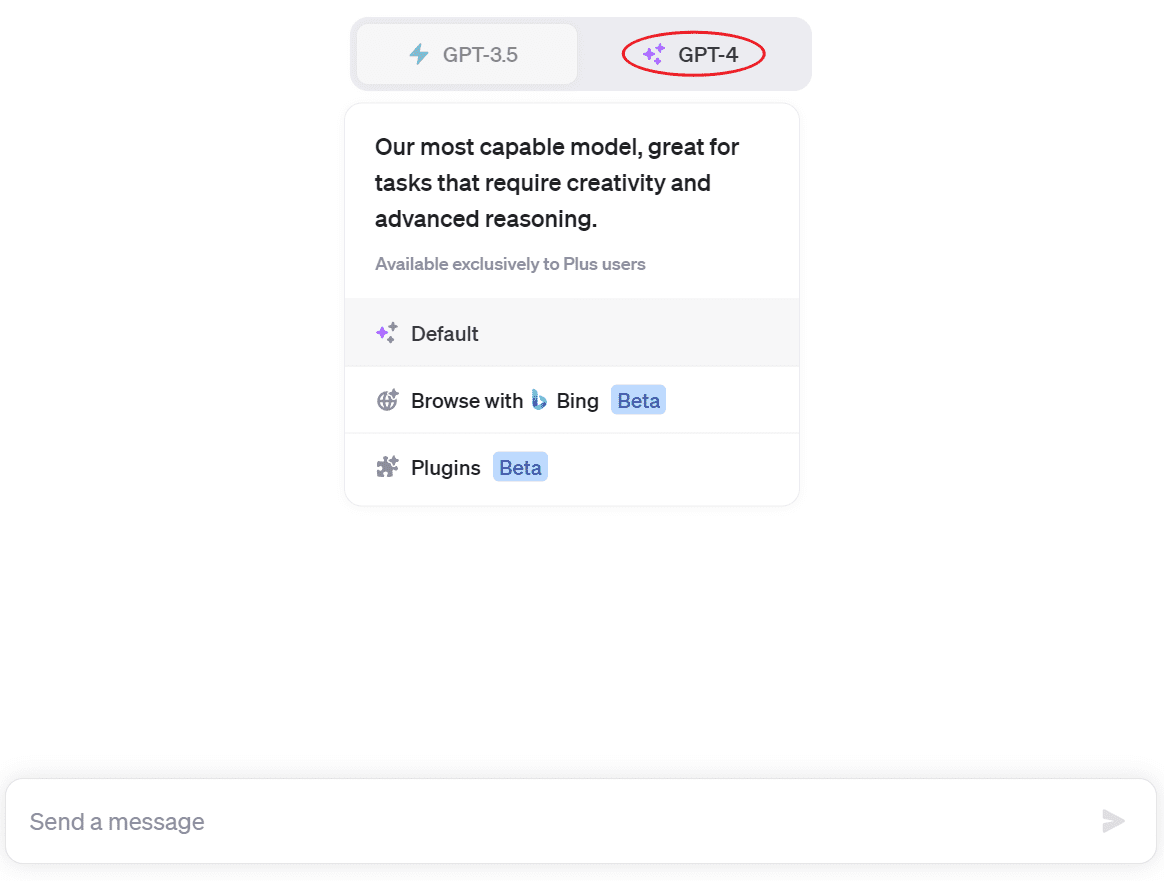
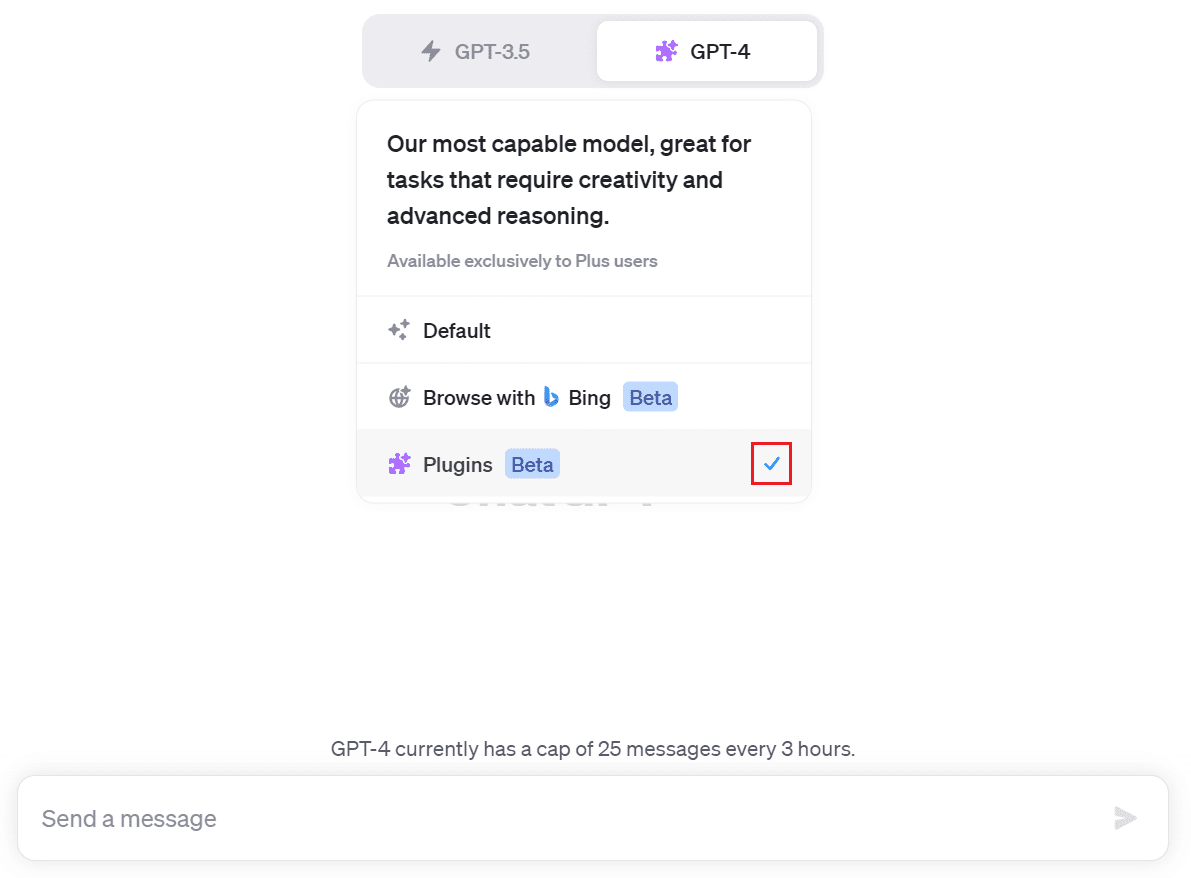
Once installed, switch to ChatGPT4.
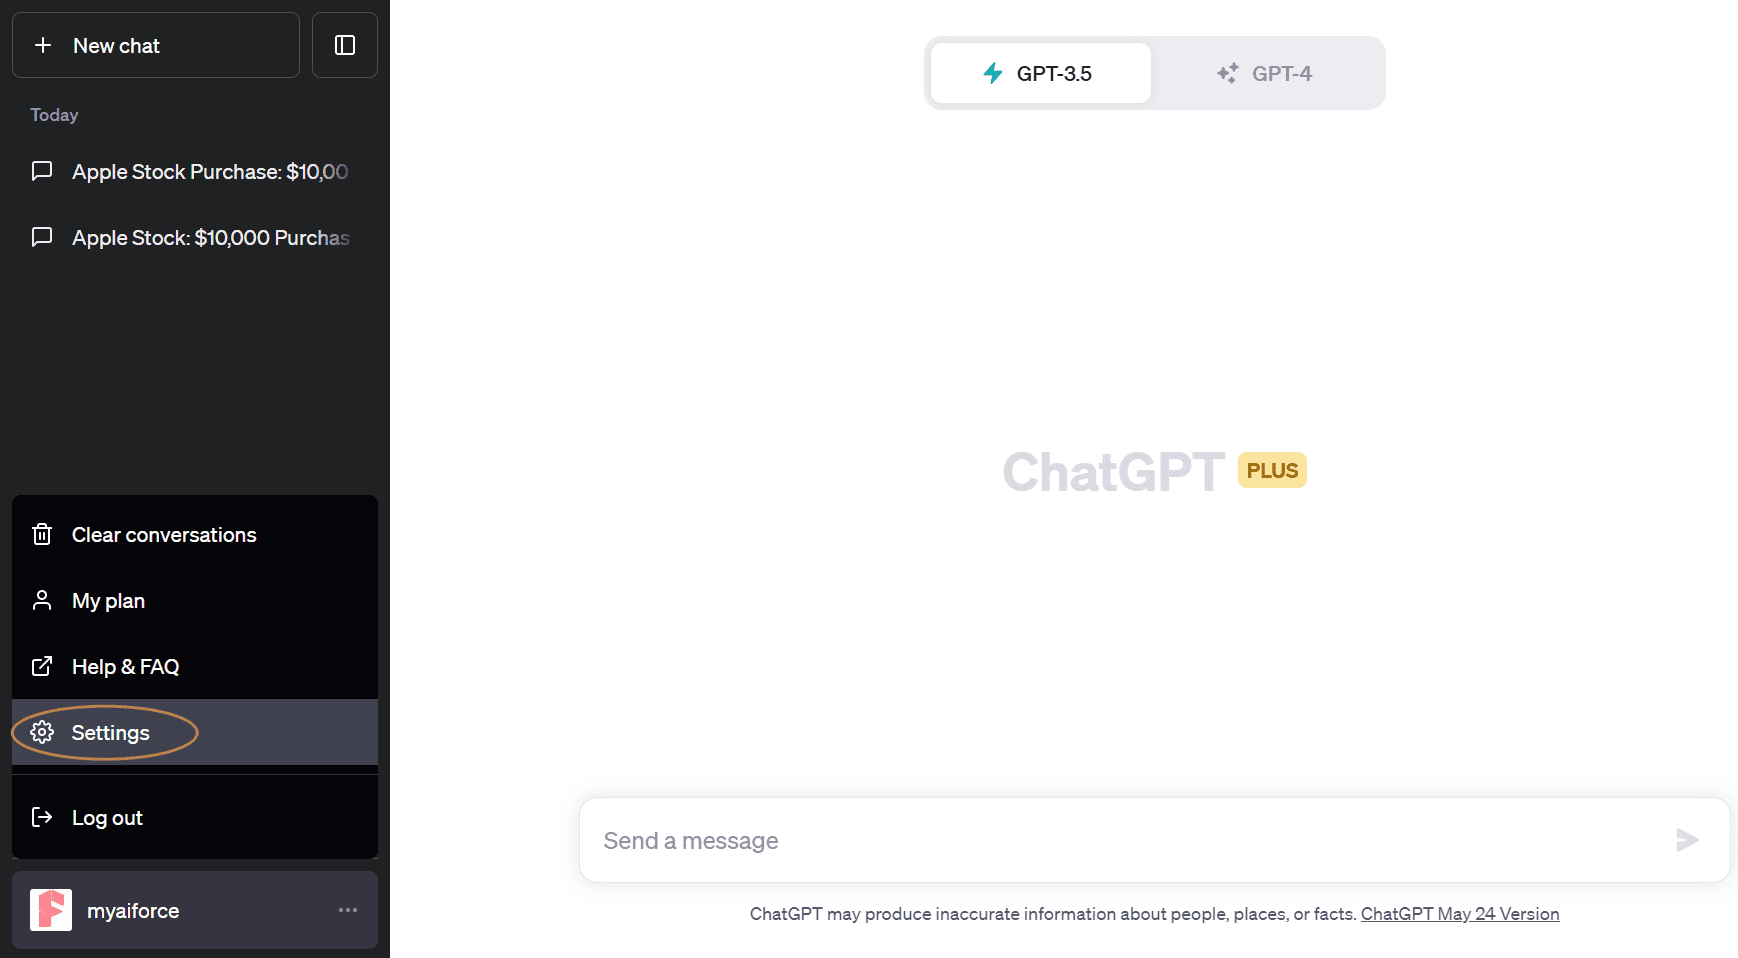
Hover over the “GPT-4” button to reveal a drop-down menu, then click on “Plugins”.
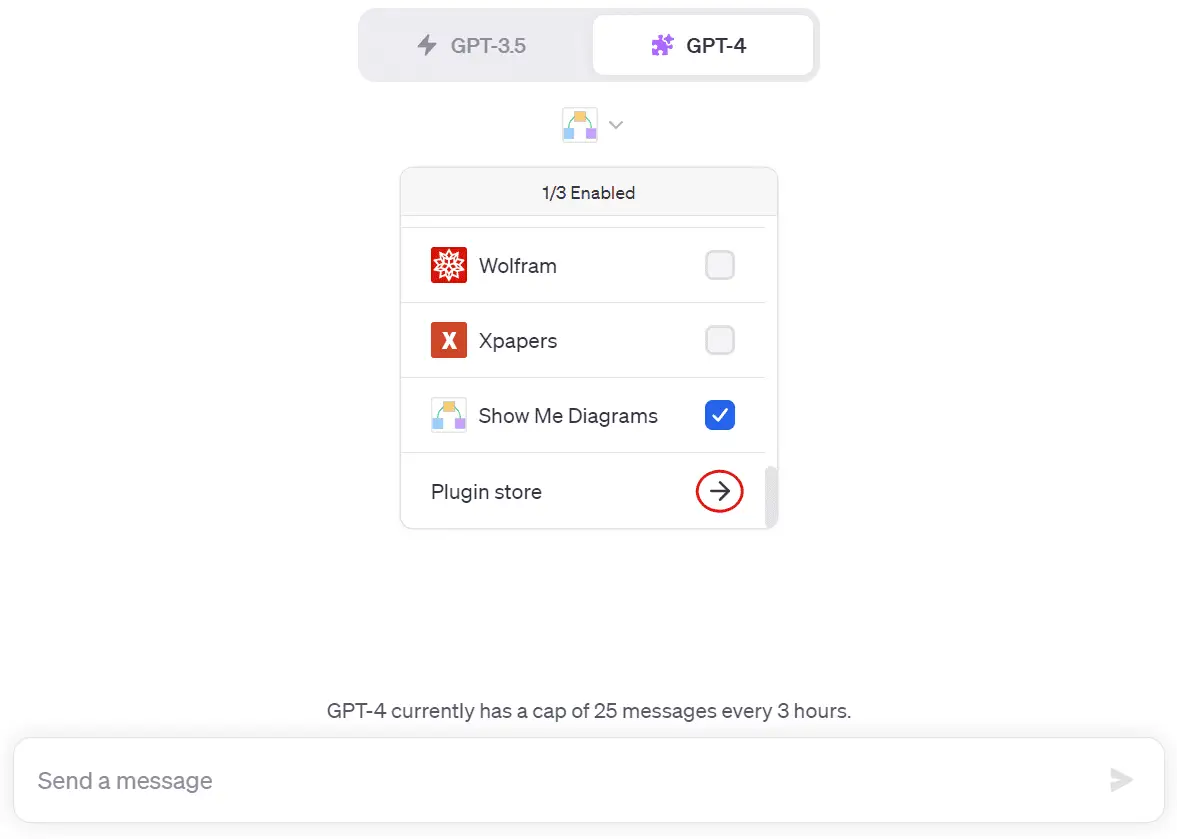
You’ll find the “Show Me Diagrams” plugin in the dropdown menu below the ChatGPT4 button. Check it.
Now you’re ready to enter your prompt, such as:
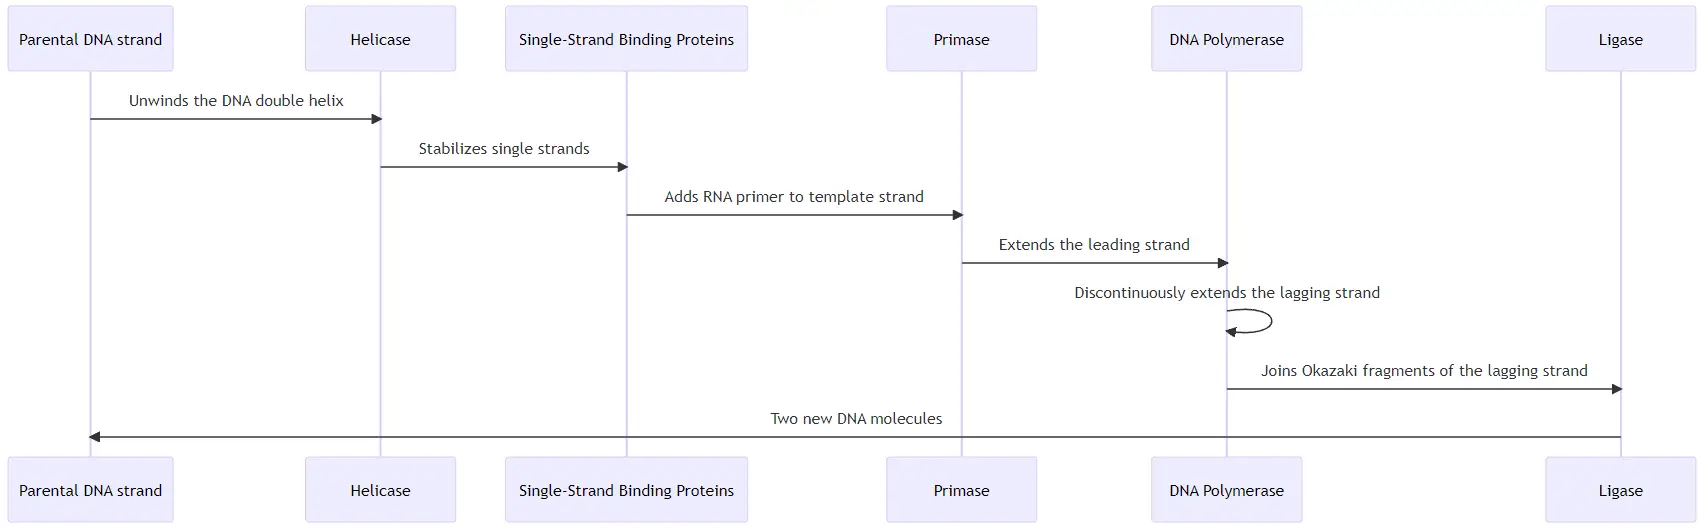
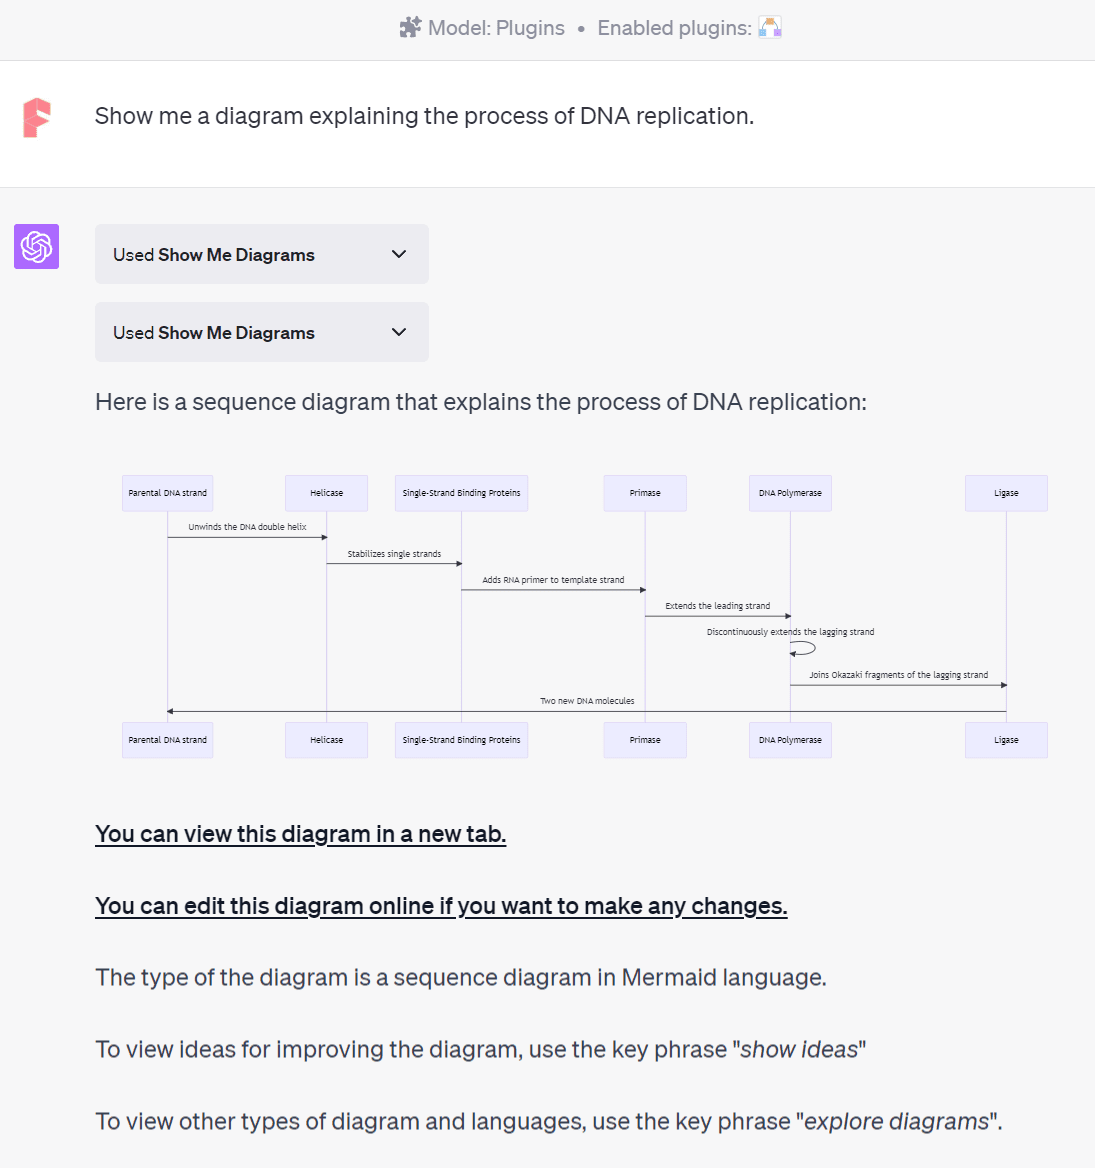
Show me a diagram explaining the process of DNA replication.
After you submit your prompt, ChatGPT will respond like this:
Here is a sequence diagram that explains the process of DNA replication:
You can view this diagram in a new tab.
You can edit this diagram online if you want to make any changes.
The type of the diagram is a sequence diagram in Mermaid language.
To view ideas for improving the diagram, use the key phrase “show ideas”
To view other types of diagram and languages, use the key phrase “explore diagrams”.
You can view the generated diagram by clicking on “You can view this diagram in a new tab” in ChatGPT’s response. To edit it online, click on “You can edit this diagram online if you want to make any changes”.
You can refine your diagram by entering specific phrases as instructed by ChatGPT. For instance, typing “show ideas” prompts this response from ChatGPT:
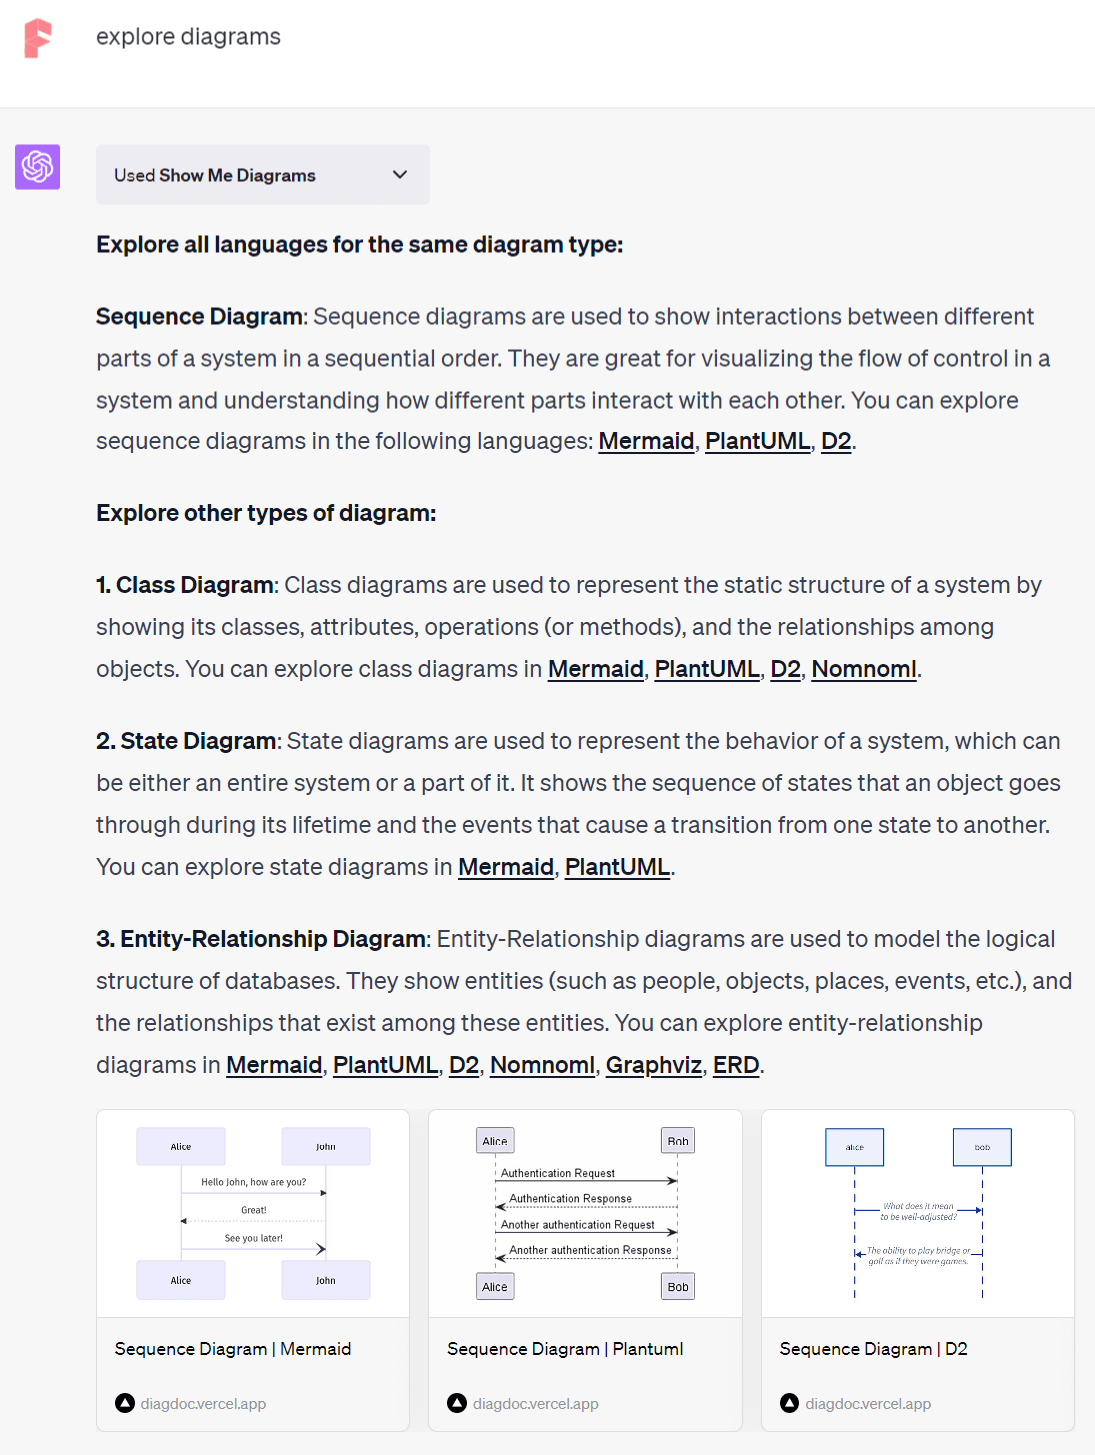
By default, Show Me Diagrams uses Mermaid.js for creating diagrams. However, according to ChatGPT, you can use the phrase “explore diagrams” to discover other diagram types.
When I used this phrase, ChatGPT responded:
Explore all languages for the same diagram type:
Sequence Diagram: Sequence diagrams are used to show interactions between different parts of a system in a sequential order. They are great for visualizing the flow of control in a system and understanding how different parts interact with each other. You can explore sequence diagrams in the following languages: Mermaid, PlantUML, D2.
Explore other types of diagram:
1. Class Diagram: Class diagrams are used to represent the static structure of a system by showing its classes, attributes, operations (or methods), and the relationships among objects. You can explore class diagrams in Mermaid, PlantUML, D2, Nomnoml.
2. State Diagram: State diagrams are used to represent the behavior of a system, which can be either an entire system or a part of it. It shows the sequence of states that an object goes through during its lifetime and the events that cause a transition from one state to another. You can explore state diagrams in Mermaid, PlantUML.
3. Entity-Relationship Diagram: Entity-Relationship diagrams are used to model the logical structure of databases. They show entities (such as people, objects, places, events, etc.), and the relationships that exist among these entities. You can explore entity-relationship diagrams in Mermaid, PlantUML, D2, Nomnoml, Graphviz, ERD.
Other diagramming languages, such as PlantUML, D2, Nomnoml, Graphviz, and ERD are also available. For more information on these, click on the respective hyperlinks provided.
Summary
In conclusion, creating diagrams doesn’t have to be a daunting task. With tools like the Google Chrome extension “ChatGPT Diagrams” and ChatGPT plugin “Show Me Diagrams”, both Free and Plus ChatGPT users can simplify the process.
By taking advantage of these plugins and ChatGPT’s capabilities, you can translate complex ideas into visual language with just a few clicks. Remember, the key is in clear communication and effective utilization of these tools. So, don’t hesitate – start diagramming your ideas today!
Ever been overwhelmed with a batch of images needing edits, but lacked the software or skills? Welcome to the world of Code Interpreter! Don’t be fooled by its name; it’s a powerhouse for image editing, using Python to seamlessly manipulate your visuals. But you don’t need to master Python. Code Interpreter shines with its ability…
Since it first came out, ChatGPT has wowed people everywhere with its incredible way with words, especially in the world of translation. A lot of people want to know how well it translates. As a frequent user of ChatGPT, I often use it to translate content, sometimes alongside other tools like DeepL. In this article,…
ChatGPT has been a game-changer for our productivity! It’s like having a digital Swiss Army knife, tackling tasks from summarizing articles to drafting emails, and finding creative solutions. But, how do we harness its output effectively? Moving beyond the old copy-paste method, we’ve found a new ally: GPTs. GPTs aren’t just about running custom workflows;…
Google’s chatbot Bard, integrated with DeepMind’s LLM Gemini Pro, has recently captured my attention. Previously, I hadn’t given Bard much thought, but the incorporation of Gemini Pro has been a game-changer, setting new standards that even GPT-4 struggles to meet. I’ve previously delved into a detailed comparison between Gemini Pro and GPT-4, which you can…
ChatGPT, a language model, lets users analyze vast amounts of data through conversation, reshaping data analysis. Whether you use ChatGPT’s code interpreter or third-party plug-ins like Noteable, you can simply describe what you want to do, and ChatGPT will help you analyze your data, generate charts, and present the results. I used a Kaggle dataset…
The ascendancy of ChatGPT affirms the undisputed power of data. It owes its vast reservoir of knowledge to its capacity to sift through millions of data points online, and train itself into an expansive language model. This marks an era where command over valuable data signifies the strength of voice in the world of artificial…