Mastering LoRA Testing in ComfyUI with XYZ Plot
In a previous post, Training Face LoRA, I detailed the use of XYZplot in A1111 to examine a batch of trained LoRA.
While XYZplot in A1111 proved quite resourceful, its processing speed in handling a large number of images was notably slower than ComfyUI, often exceeding half an hour.
This article aims to guide you through the faster, more efficient process of using XYZplot within ComfyUI for LoRA testing, a method that simplifies the workflow to just four nodes.
Let’s dive in!
For those who love diving into Stable Diffusion with video content, you’re invited to check out the engaging video tutorial that complements this article:
Gain exclusive access to advanced ComfyUI workflows and resources by joining our community now!
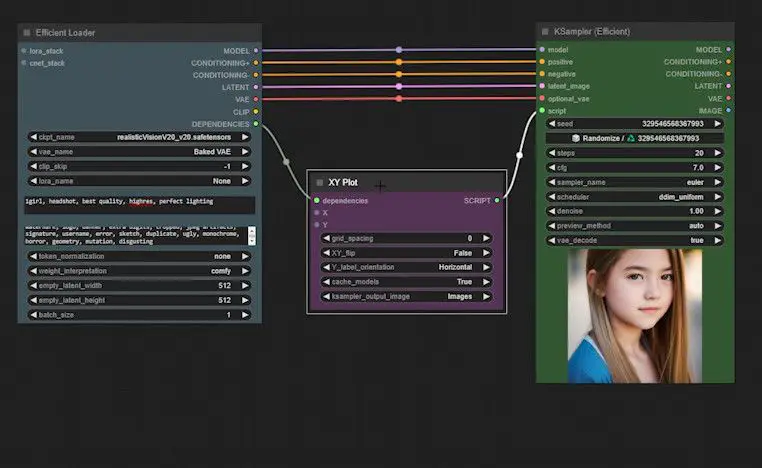
Step 1: Setting Up the Efficiency Loader and KSampler
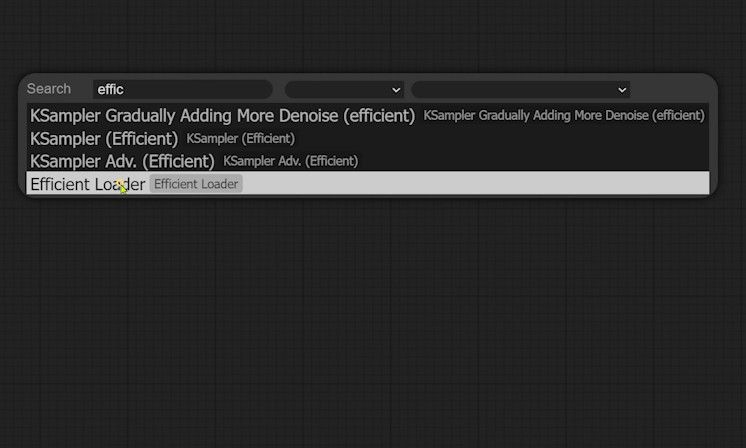
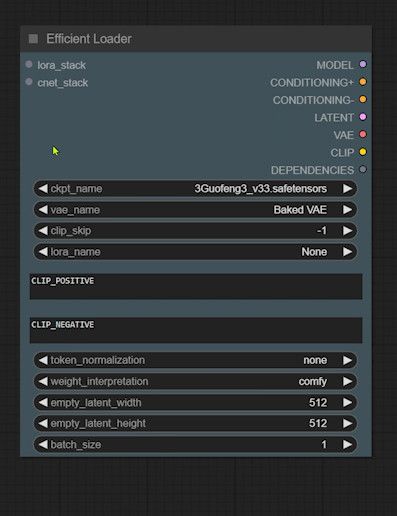
Begin by launching the ComfyUI interface. To access the search node toolbar, double-click using the left mouse button. Type “efficient” into the search box to locate and select the “Efficient Loader” node.
If this node is unfamiliar to you, feel free to revisit my prior discussion on its functionality in How to Use LoRA in ComfyUI.
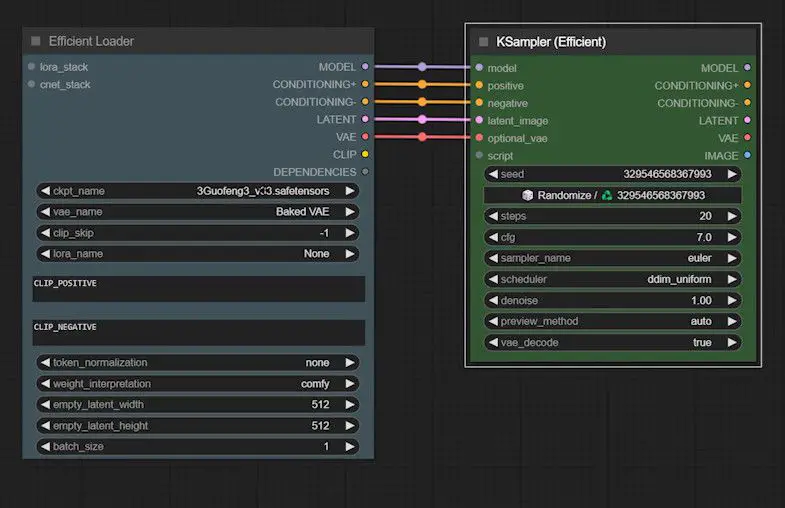
Next, we need to integrate a KSampler for image generation. Reopen the search bar, enter “efficient” again, and select the KSampler node tagged as “Efficient.”
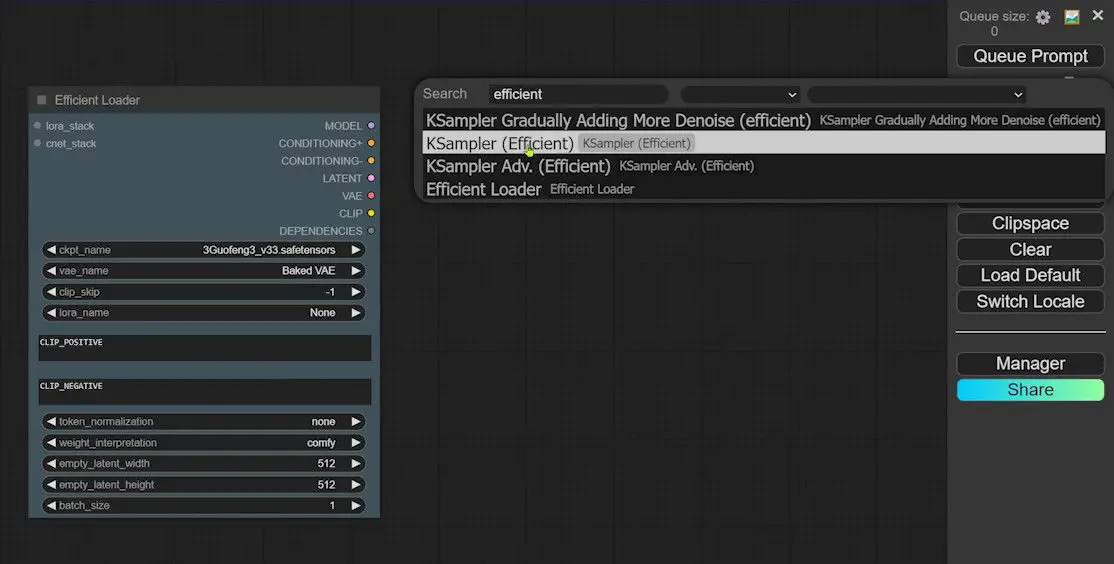
This node is specifically tailored to function alongside the Efficiency Loader. Once connected, your basic setup is complete.
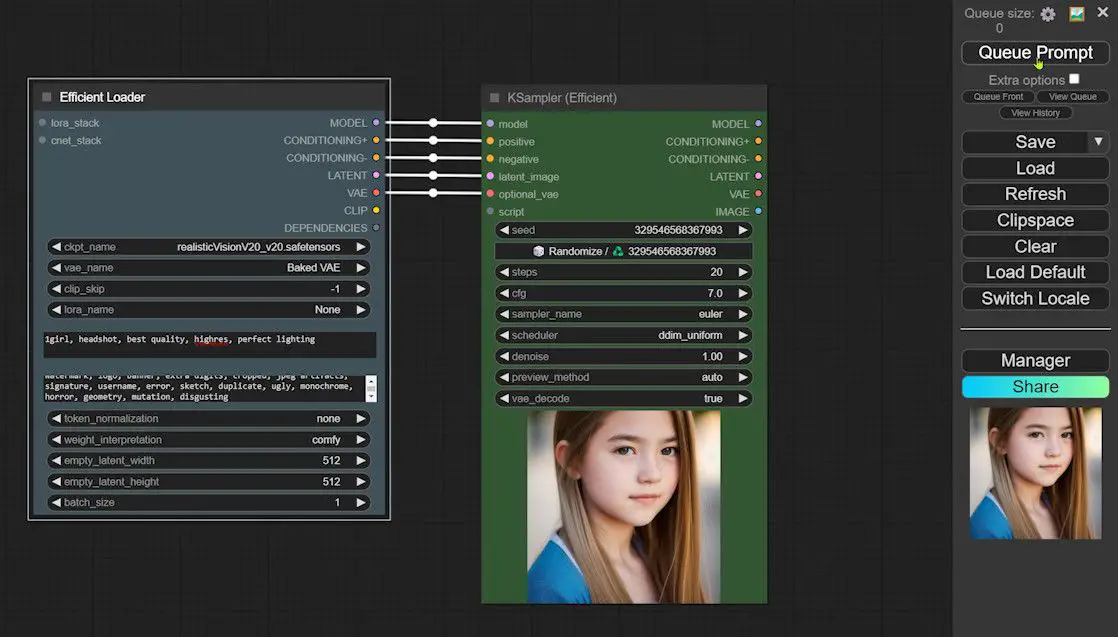
Step 2: Selecting a Model and Generating a Test Image
Now, it’s time to select an appropriate checkpoint and enter the required prompts. Generate a test image in ComfyUI , ensuring it displays correctly.
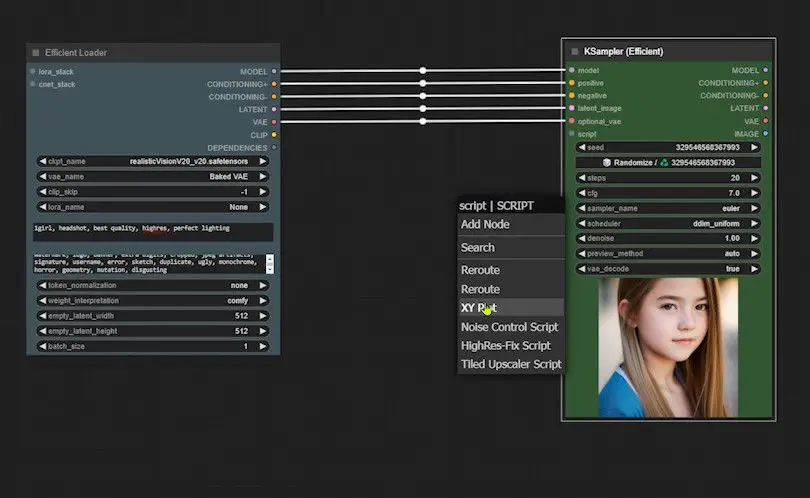
Step 3: Accessing and Configuring XYZplot
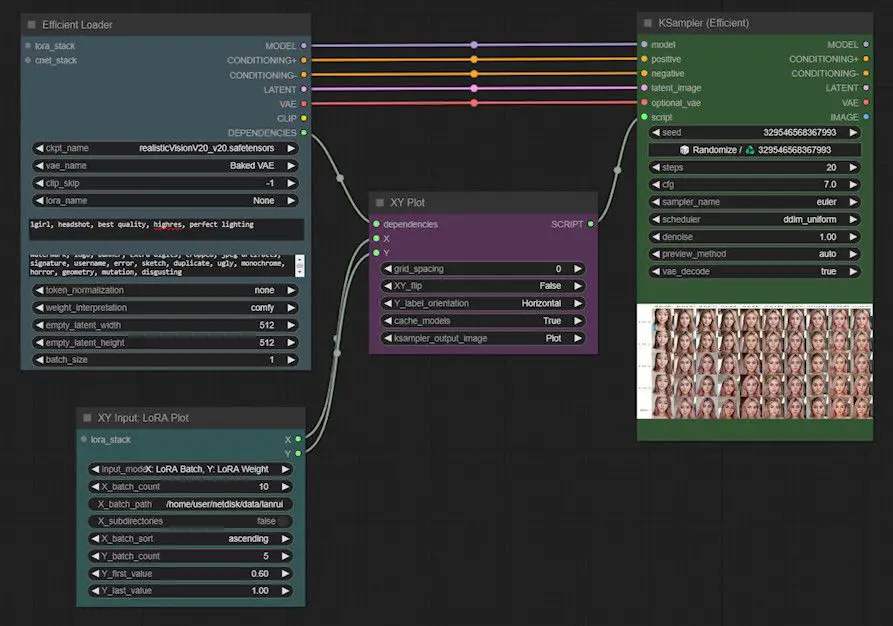
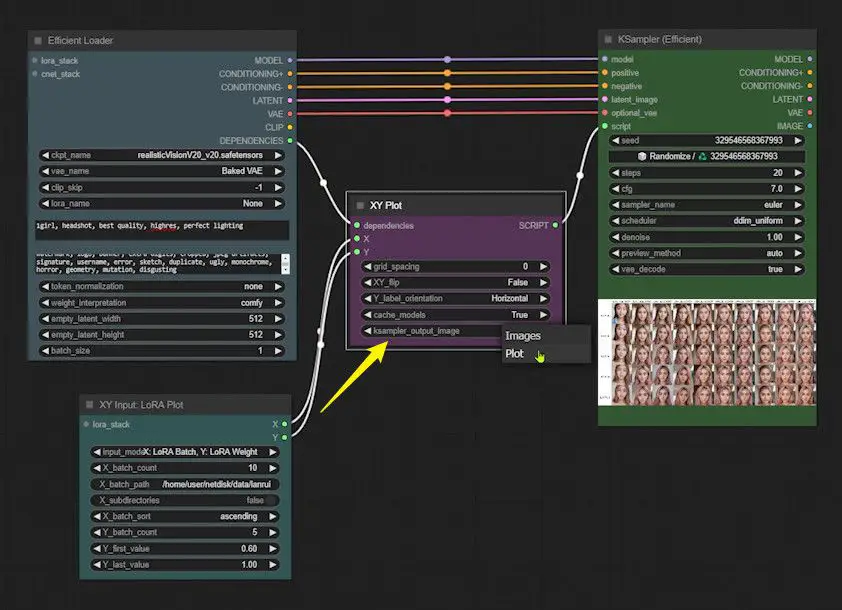
Adjust the placement of the Efficiency Loader and KSampler nodes to allow space for subsequent nodes. Locate the “script” input port on the KSampler node. Click and drag this port to select the “XY Plot” option that appears.
Connect the “dependencies” input of this plot to the Efficiency Loader’s corresponding output.
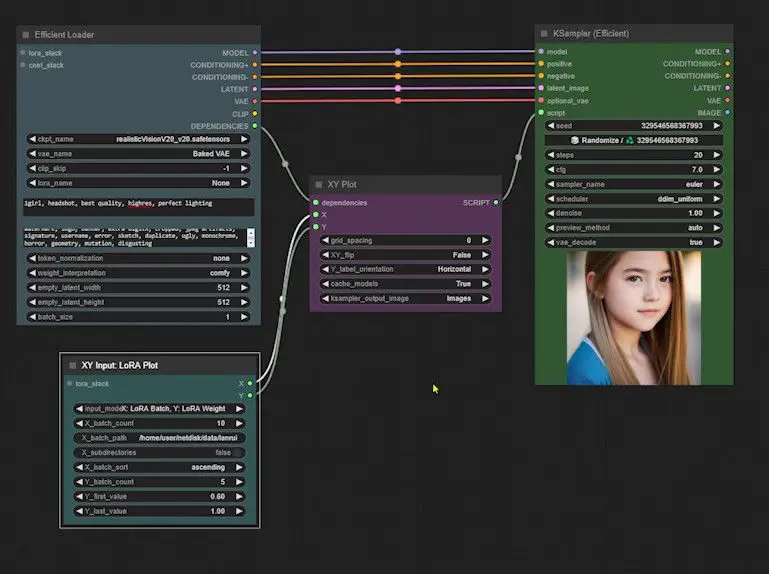
Configure the axes of the XY plot by clicking and dragging its input. For the X-axis, type “lora” into the search box, select the displayed LoRA plot.
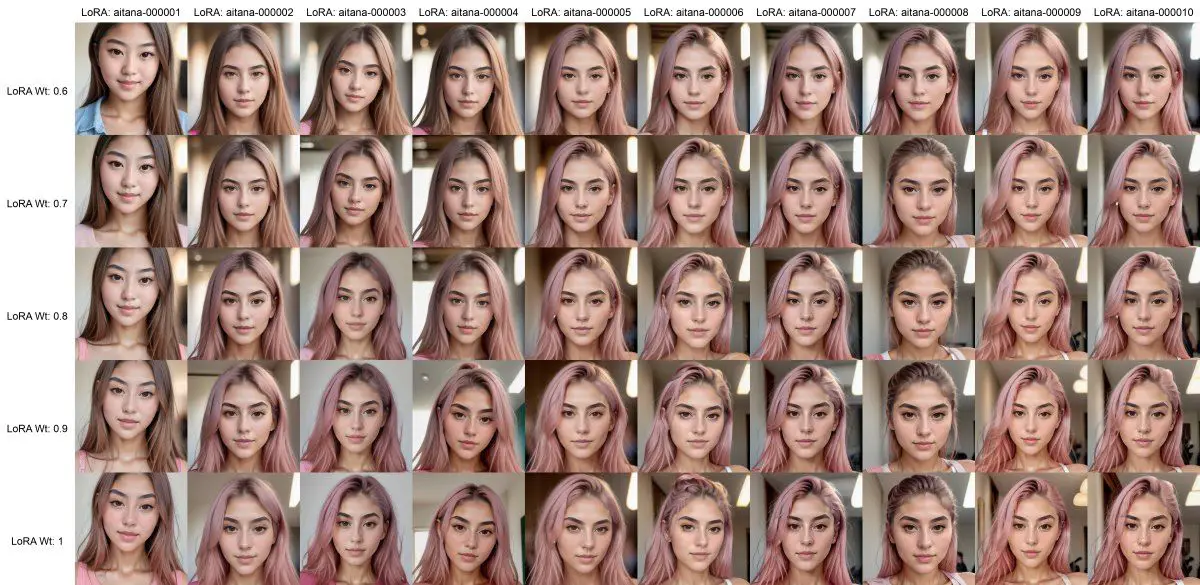
And set the number of LoRAs to test (e.g., 10 versions). For the Y-axis, input a weight range (e.g., from 0.6 to 1 across five points), starting at 0.6 and ending at 1. Ensure you also connect the output of the Y-axis.
Step 4: Generating and Saving XYZplot
After finalizing the settings, generate the plot and review the results.
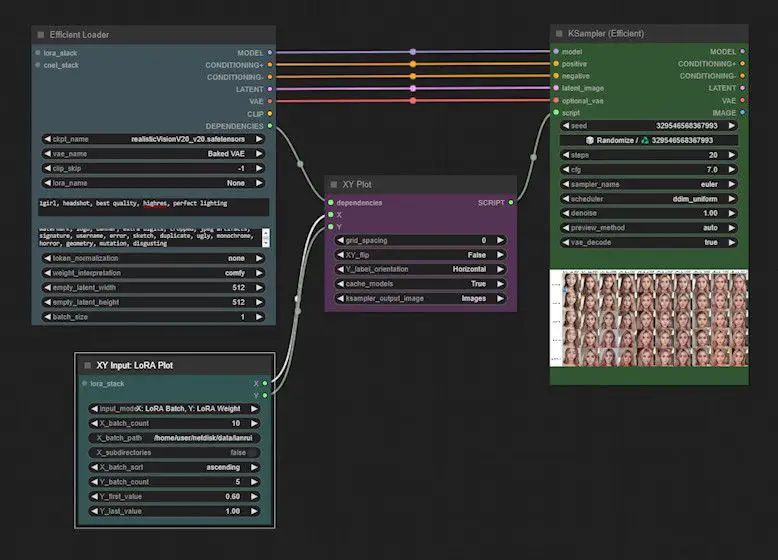
By right-clicking on the KSampler node and selecting “Open Image,” you can view the 10 LoRAs displayed along the X-axis and the range of weights from 0.6 to 1 along the Y-axis.
If you wish to save the image, simply right-click on it and choose “Save Image As.”
Additionally, return to the ComfyUI settings to confirm that the “ksampler_output_image” parameter is appropriately configured in the plot.
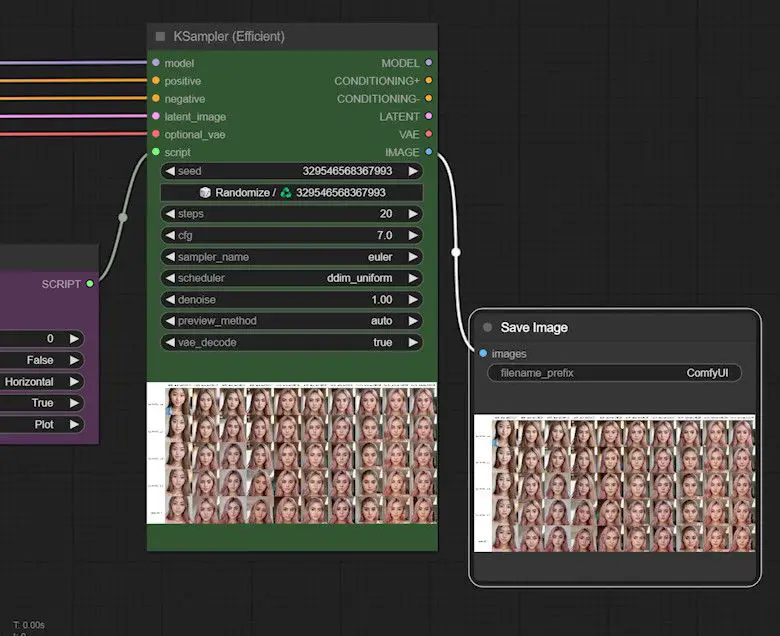
Then, drag a “save image” node onto the image output of the KSampler node and run ComfyUI again. This allows the XYplot to be saved to the ComfyUI output directory for easy access and utilization.
This concludes our guide on utilizing XYZplot for testing LoRA in ComfyUI. I hope you find this tutorial beneficial as you navigate the intricacies of LoRA testing with enhanced efficiency and precision. Happy testing!